eQTLs (cis, response)
Changelog
2021-06-10: Initial data release
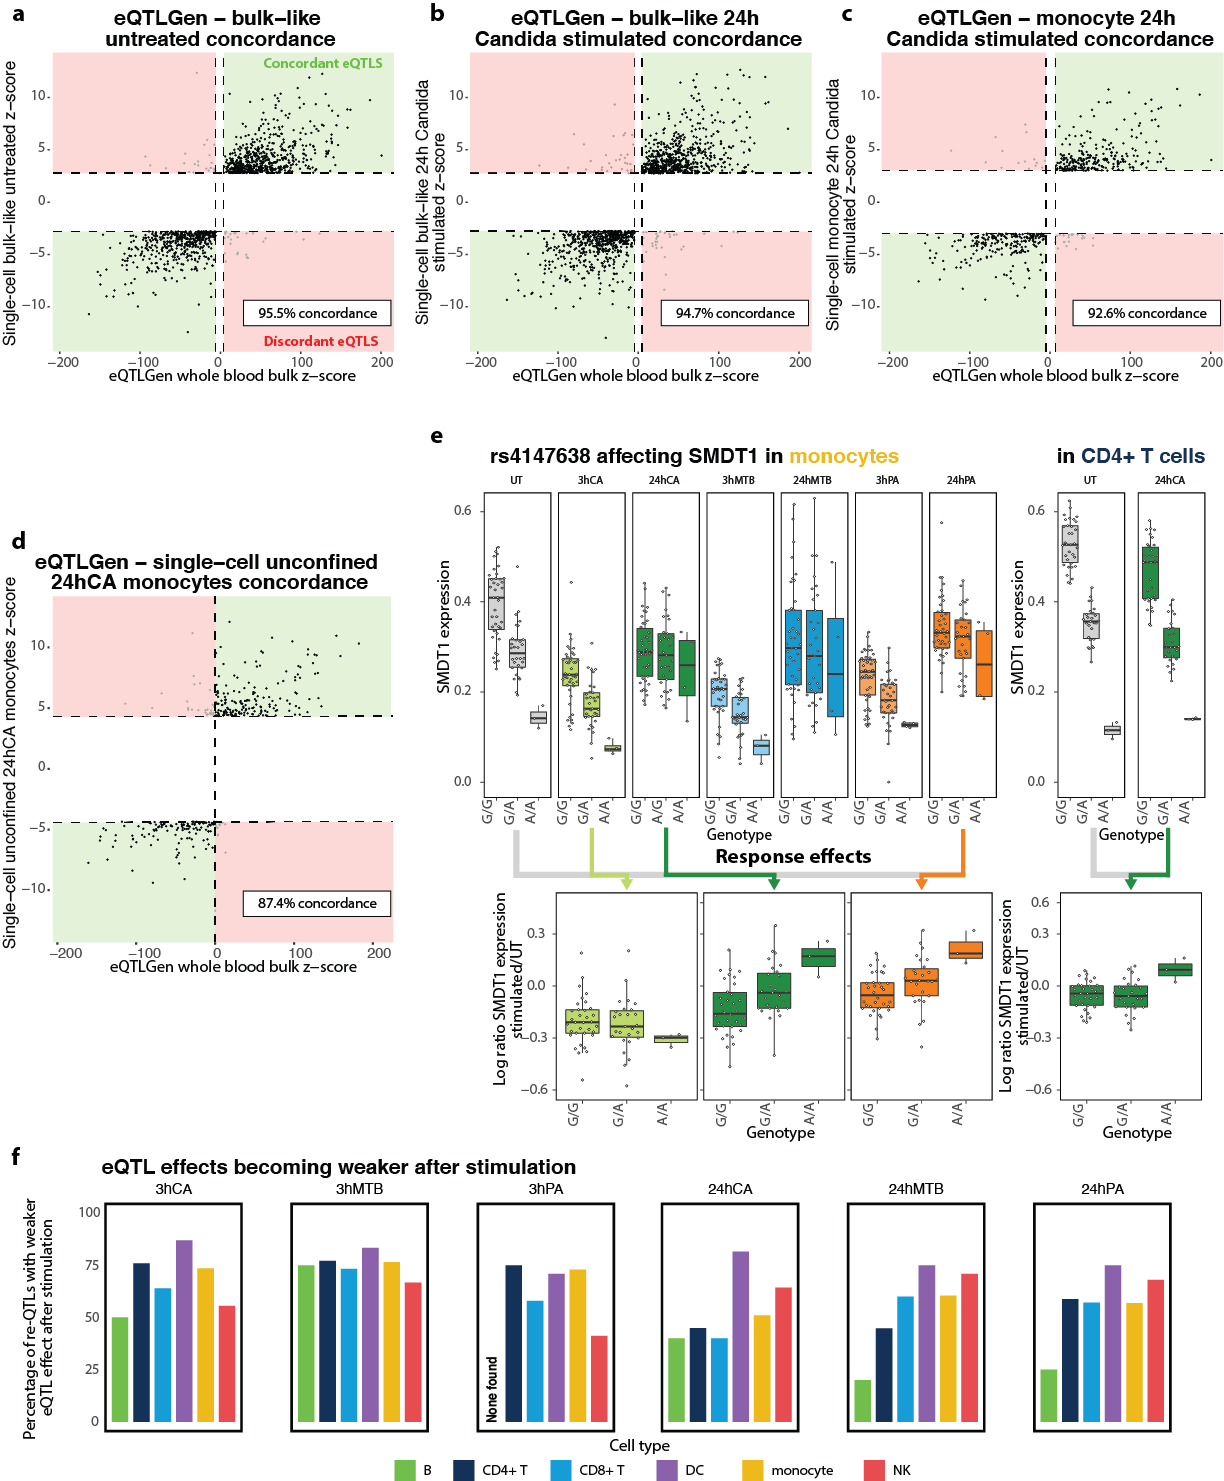
Concordance between the eQTLs identified in 31,684 bulk whole blood samples of the eQTLGen consortium and: a. those identified in our eQTLGen lead-eSNP discovery of bulk-like unstimulated PBMC scRNA-seq data, b. those identified in our eQTLGen lead-eSNP discovery of bulk-like 24h C. Albicans (CA)-stimulated PBMC scRNA-seq data, c. those identified in our eQTLGen lead-eSNP discovery of monocyte 24h CA-stimulated PBMC scRNA-seq data, and d. those identified in our genome-wide eQTL discovery of monocyte 24h CA-stimulated PBMC scRNA-seq data. e. Box plots showing the effect of the rs4147638 genotype on SMDT1 expression in the untreated (UT) condition and each of the six stimulation timepoint combinations in the monocytes (left) or for the UT and 24h CA condition in the CD4+ T cells (right). Box plots show median, first and third quartiles, and 1.53×3the interquartile range, and each dot represents the average expression of all cells per cell type and individual. Stars indicate a significant effect (FDR < 0.001). The log ratio of SMDT1 expression in the UT cells vs a specific stimulation-timepoint combination is shown in the bottom. Colored arrows indicate which specific stimulation timepoint combination was selected for the corresponding re-QTL boxplot. f. The proportion of re-QTLs of which the eQTL effect became weaker after stimulation, split per cell type and stimulation-timepoint combination.